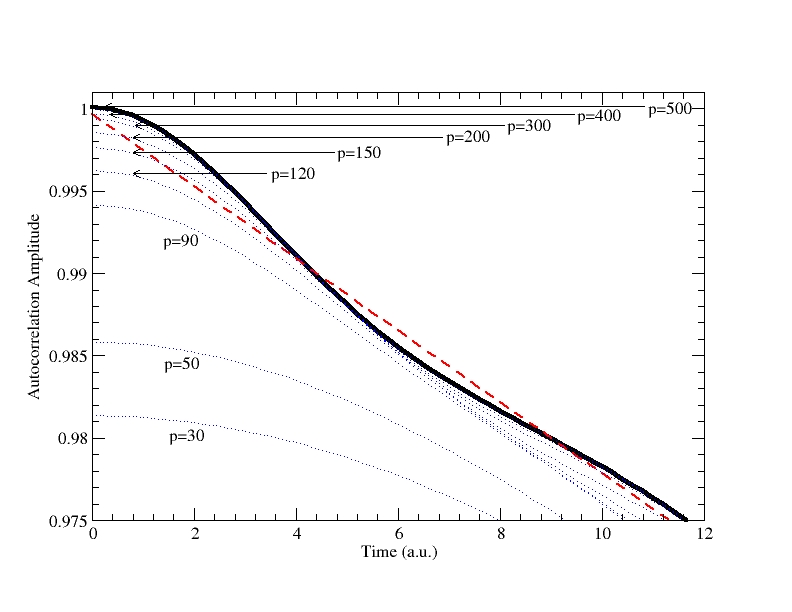
Figure 8:
Autocorrelation amplitude (solid curve)
. The dashed curve corresponds to an exponential fit. Other curves: analytic expansion from Eq.(
27
), for a different number
p
of functions included in the sum.